Niagara Simple Line Chart (FREE)


  • Real-Time Animation & Updates
  • Binds to History BQL Query
  • Change Labels, Legend, or Date Display Format
  • Clean pristine animation
  • Works in Workbench and Modern Browser
Add to Cart
n4 charting

Overview


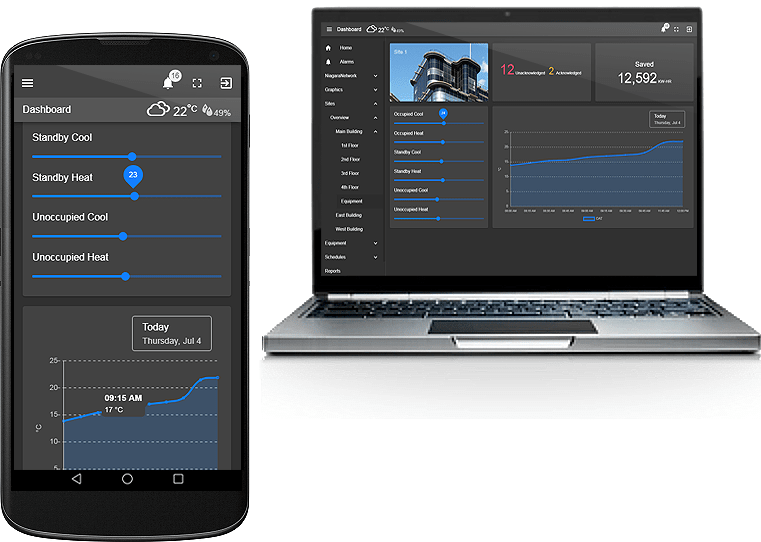
Drag and drop the Simple Line Chart widget from the palette onto your px view. It automatically updates when the history value changes. Its completely configurable and easy to use. Also check out the Energy View Template.

Are you looking for a cost effective way to manage and visualize data for all your customers? Why not have a look at View Builder?

Usage


Before you start. Download the modules from our portal (see your order confirmation, which also explains licensing). Copy the modules file to your modules directory. Restart BOTH station and Workbench.

1. Copy the simpleLineChart-ux.jar file to your modules directory.
2. Open the module from your palette file.
3. Drag and drop the widget from the palette onto your px view.

Tridium charting library


Properties


The chart has a number of configurable properties that can be used to modify look, feel, and functionality. Change the properties as required. Widget Properties

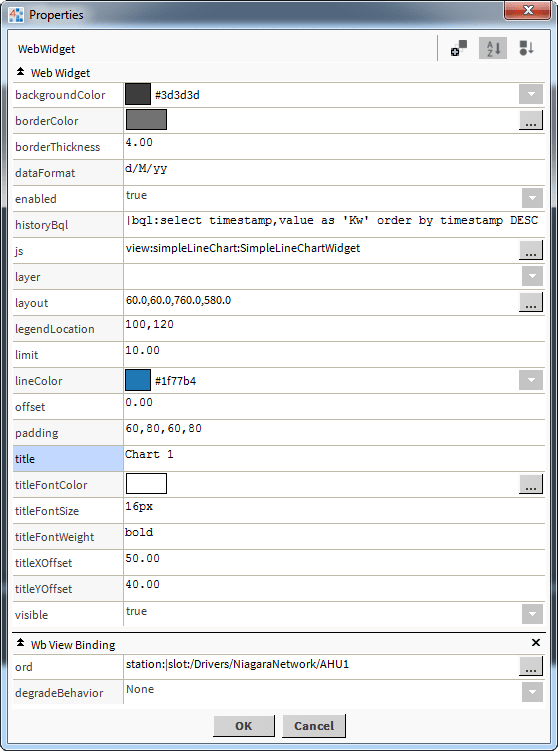
Changing Widget Properties - most properties are self-explanatory but some require some explaining.

Ord Value - this is the live value of the meter or the main meter value. The ord reference should be a numeric point or numeric writable. It can an absolute ord, e.g.
station:|slot:/Drivers/NiagaraNetwork/AHU5 or relativized ORD e.g.
slot:AHU5
The ord should point to a numeric point/writable that has a numeric interval extension.
OR
You can reference a history ord directly e.g.
history:/demoStation/AHU5

Date Format.

Examples:

  • dddd h:mmtt d MMM yyyy = Friday 9:49am 19 Jan 2018
  • M/d/y = 1/19/2018
  • HH:mm:ss = 09:49:29
  • hh:mm:ss TT = 09:49:39 AM
  • yy/M/d = 18/1/19
  • ddd MMM d \a\t h:mm TT = Fri Jan 19 at 9:49 AM


History BQL.

You must bind the chart to a history bql query.
1. Set the value binding to a actual point.
Example: station:|slot:/Drivers/NiagaraNetwork/AHU1

2. Set the history BQL property.
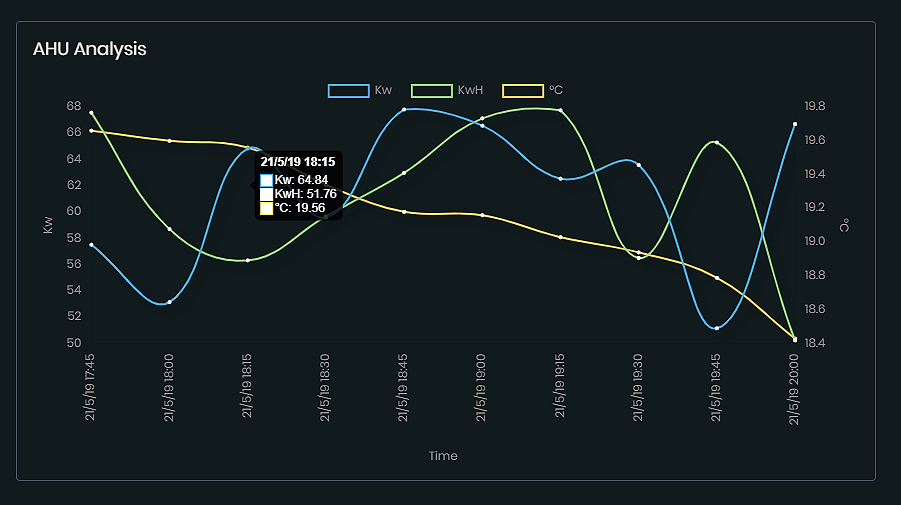
Example 1: |bql:select timestamp,value as 'Kw' order by timestamp DESC
Example 2: ?period=weekToDate|bql:select timestamp, value order by timestamp DESC


Using in your HTML Page


You can now use the widget in your custom html page as long as the html file is in a appropriate station directory. E.g.:
C:/../station/shared/demo1.html

1. Create an html page and place in your station files directory.
2. Create a div element and give it an id so you can inject the widget into this area. E.g.: widget1.
3. Add the following scripts before the closing head tag or the closing body tag. E.g.:

    
        <script type="text/javascript">

            var require = {
                paths: {
                    "nmodule": "/module",
                    "baja": "/module/bajaScript/rc/plugin/baja",
                    "bajaScript": "/module/bajaScript/rc",
                    "bajaux": "/module/bajaux/rc",
                    "lex": "/module/js/rc/lex/lexplugin",
                    "css": "/module/js/com/tridium/js/ext/require/css",

                    "jquery": "/module/js/rc/jquery/jquery-2.1.1",  // For N4.4 or higher use /module/js/rc/jquery/jquery-3.2.0.min
                    "Promise": "/module/js/rc/bluebird/bluebird",

                    // these are runtime dependencies
                    "hbs": "/module/js/rc/require-handlebars-plugin/hbs", // For N4.4 or higher use /module/js/rc/handlebars/handlebars.min-v4.0.6
                    "i18nprecompile": "/module/js/rc/require-handlebars-plugin/hbs/i18nprecompile",
                    "json2": "/module/js/rc/require-handlebars-plugin/hbs/json2",
                    "underscore": "/module/js/rc/underscore/underscore",
                },

                hbs: {
                    disableI18n: true
                }
            }
        </script>
        <script type="text/javascript" src="/module/js/com/tridium/js/ext/require/require.min.js"></script>
        <script>
            require(['/module/simpleLineChart/rc/simpleLineChartWidget.run.js'], function (app) {

                app.initialiseSimpleChart({
                    backgroundColor: '#3D3D3D',
                    borderColor: '#727272',
                    borderThickness: 4,
                    dateFormat: 'd/M/yy',
                    divId: '#widget1',
                    historyBql: "|bql:select timestamp,value as 'Kw' order by timestamp DESC",
                    legendLocation: '100,120',
                    limit: 10,
                    lineColor: '#1f77b4',
                    offset: 0,
                    ord: 'station:|slot:/Drivers/NiagaraNetwork/AHU2', // use absolute ord
                    padding: '60,80,60,80',
                    titleFontColor: '#fff',
                    titleFontSize: '16px',
                    titleFontWeight: 'bold',
                    titleXOffset: 50,
                    titleYOffset: 40,
                    title: 'Chart 1',
                });
            });
        </script>
        </head>
        <!--html to go here-->
        <div id="widget1" style="width:300px;height:300px;"></div>
        <!--Rest of your html below...-->
                                    

You May Also Like


Energy Benchmark Chart

N4 View Builder™©

tridium bms system

Multiline Chart

tridium charting

back to more widgets...