Niagara Multiline Chart


  • Compare up to 4 Data Sets and 2 Static Values
  • Updates in Real-Time
  • Uses BQL Query to Collate History Data
  • Modify to Your Style
  • Works in Workbench and Modern Browser
Add to Cart
n4 charting

Overview


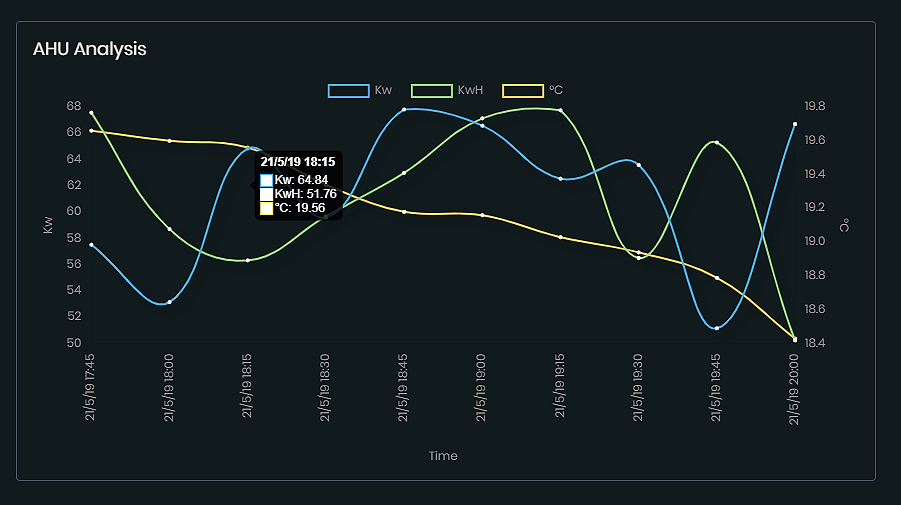
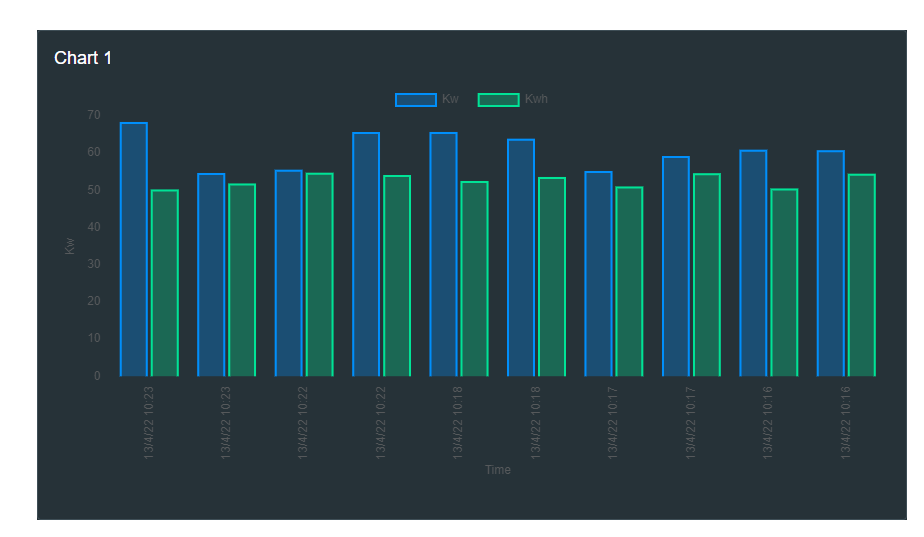
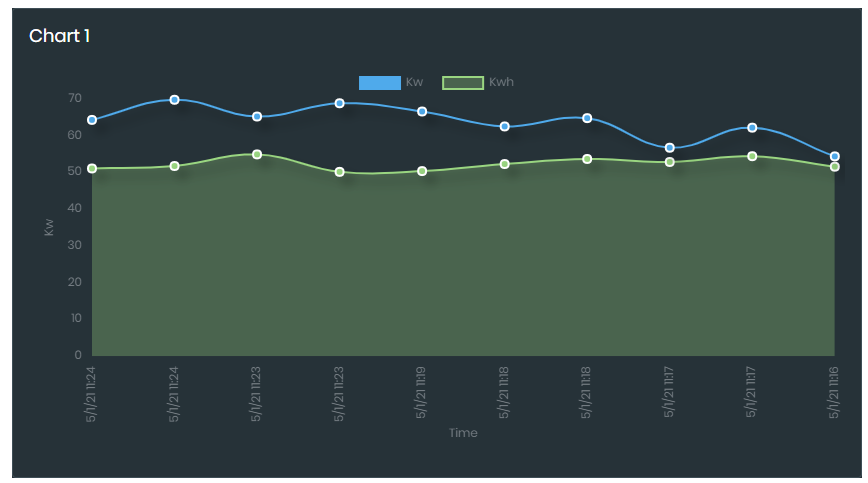
The multiline chart plots up to 4 lines and 2 static lines on a chart for analysis. Ords should be bound to histories with similar time frames for advanced comparison. The 2 static lines are set values you can use for comparison, e.g. Hi and Lo. In total, 5 lines can be plotted. It updates in real-time and uses bql queries to collate the data. The chart has a number of configurable properties that can be used to modify look, feel, and functionality. Also check out the Energy View Template.

Are you looking for a cost effective way to manage and visualize data for all your customers? Why not have a look at View Builder?

Usage


Before you start. Download the modules from our portal (see your order confirmation, which also explains licensing). Copy the modules file to your modules directory. Restart BOTH station and Workbench.

1. Copy the multiLineChart-ux file to your modules directory.
2. Open the module from your palette file.
3. Drag and drop the widget from the palette onto your px view.

Tridium charting library


Properties


building optimization

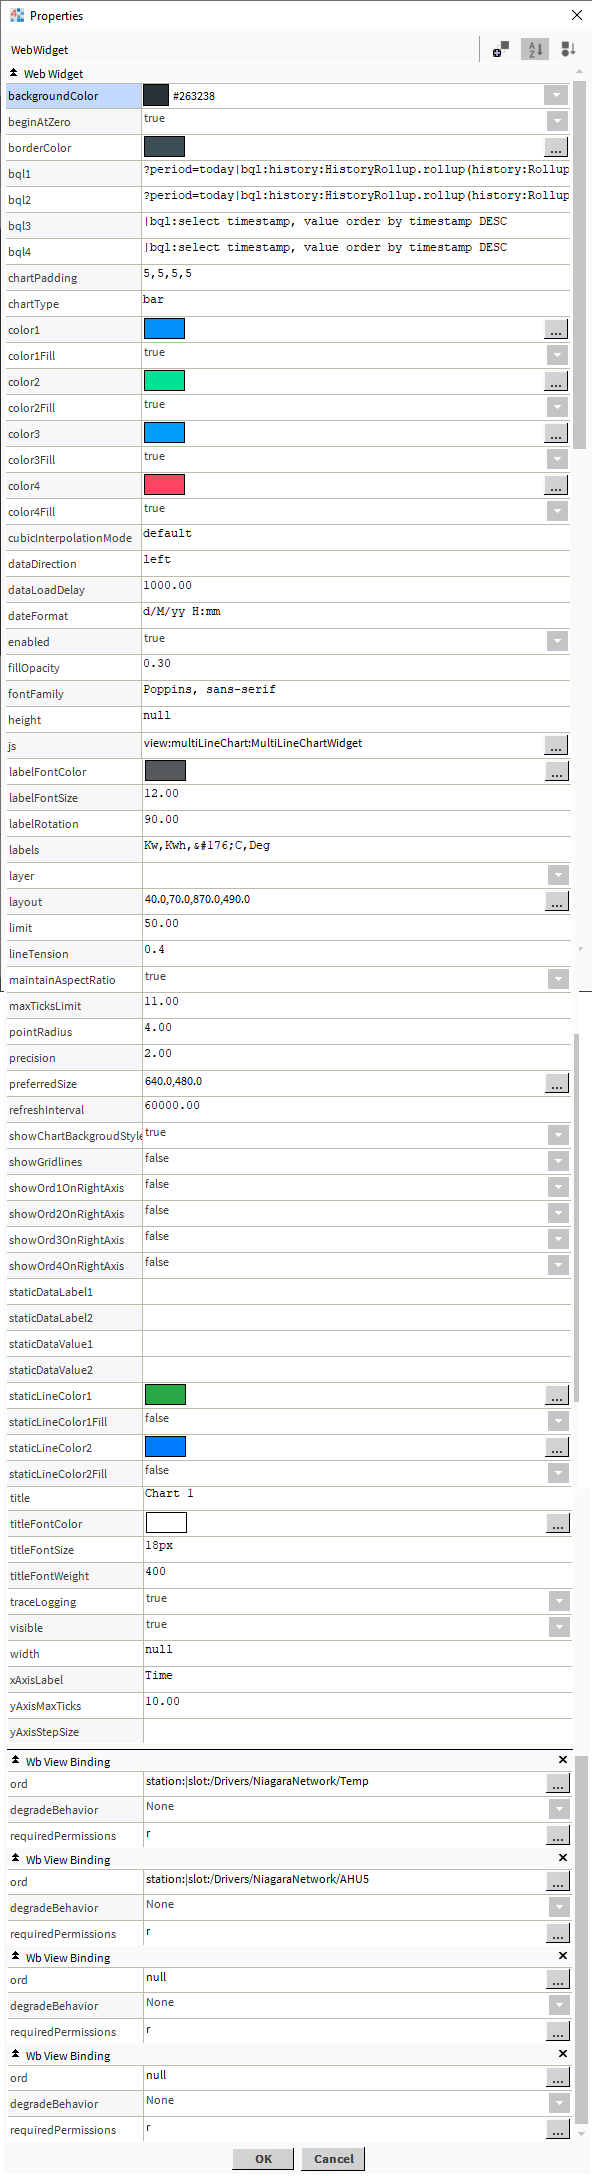
The widget has a number of configurable properties that can be used to modify look, feel, and functionality.

Changing Widget Properties - most properties are self-explanatory but some require some explaining.

Date Format

Examples:

  • dddd h:mmtt d MMM yyyy = Friday 9:49am 19 Jan 2018
  • M/d/y = 1/19/2018
  • HH:mm:ss = 09:49:29
  • hh:mm:ss TT = 09:49:39 AM
  • yy/M/d = 18/1/19
  • ddd MMM d \a\t h:mm TT = Fri Jan 19 at 9:49 AM

Labels:
Label to show for each line. If the degrees symbol needs to be used, use:

°

Widget Ords:
Set upto 4 ord values. Each collection should have the same time frame. E.g. history taken every 15 minutes. Set this to an absolute ord, e.g.
station:|slot:/Drivers/NiagaraNetwork/AHU5 or relativized ORD e.g.
slot:AHU5
The ord should point to a numeric point/writable that has a numeric interval extension or numeric change of value history extension.
OR
You can reference a history ord directly e.g.
history:/demoStation/AHU5

BQL 1,2,3,4:

Example 1: |bql:select timestamp,value as 'Kw' order by timestamp DESC
Example 2: ?period=weekToDate|bql:select timestamp, value order by timestamp DESC
Advanced: ?period=today|bql:history:HistoryRollup.rollup(history:RollupInterval 'hourly')|bql:select timestamp, max

Point Radius:
Set this to 0 if you don't want points shown on the chart.

Refresh Interval:
How often the chart data should refresh. In milliseconds.

Show Ord on Right Axis:
Set values to true or false so the values show on the right axis of the chart.

Line Tension:
Bezier curve tension of the line. Set to 0 to draw straightlines. This option is ignored if monotone cubic interpolation is used. Possible values from 0-1.

Cubic Interpolation Mode:
Algorithm used to interpolate a smooth curve from the discrete data points. Possible values are 'default' or 'monotone'.

Limit:
Maximum number of records to plot.

Max Ticks Limit:
Maximum number of ticks and gridlines to show. Use in conjunction limit property.

Maintain Aspect Ratio:
Set to true or false so the chart maintains aspect ratio. Use in conjuction with Chart Padding property.
When false, set the height and width properties.
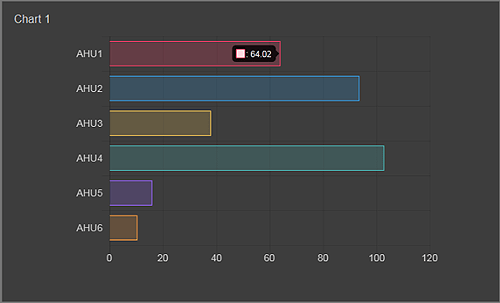
Chart Type:
Use values line or bar. When using bar, recommended to set the fill option to true. n4 bar chart

Maintain Aspect Ration:
Set to true or false so the chart maintains aspect ratio. Use in conjuction with Chart Padding property.

Chart Padding:
Default is '5,5,5,5', // top, right, bottom, left. Use in conjuction with maintainAspectRatio property.

Static Lines:
Add up to 2 static lines. Change the following properties as required:
staticLineColor1, staticLineColor2
staticDataValue1: numeric value
staticDataValue2: numeric value
staticDataLabel1: Label to show on chart

Fill Option:
n4 line chart


Using in your HTML Page


You can now use the widget in your custom html page as long as the html file is in a appropriate station directory. E.g.:
C:/../station/shared/demo1.html

1. Create an html page and place in your station files directory.
2. Create a div element and give it an id so you can inject the widget into this area. E.g.: widget1.
3. Add the following scripts before the closing head tag or the closing body tag. E.g.:

    
        script type="text/javascript">

        var require = {
        paths: {
        "nmodule": "/module",
        "baja": "/module/bajaScript/rc/plugin/baja",
        "bajaScript": "/module/bajaScript/rc",
        "bajaux": "/module/bajaux/rc",
        "lex": "/module/js/rc/lex/lexplugin",
        "css": "/module/js/com/tridium/js/ext/require/css",

        "jquery": "/module/js/rc/jquery/jquery-2.1.1",  // For N4.4 or higher use /module/js/rc/jquery/jquery-3.2.0.min
        "Promise": "/module/js/rc/bluebird/bluebird",

        // these are runtime dependencies
        "hbs": "/module/js/rc/require-handlebars-plugin/hbs", // For N4.4 or higher use /module/js/rc/handlebars/handlebars.min-v4.0.6
        "i18nprecompile": "/module/js/rc/require-handlebars-plugin/hbs/i18nprecompile",
        "json2": "/module/js/rc/require-handlebars-plugin/hbs/json2",
        "underscore": "/module/js/rc/underscore/underscore",
        },

        hbs: {
        disableI18n: true
        }
        }
        </script>
        <script type="text/javascript"
                src="/module/js/com/tridium/js/ext/require/require.min.js"></script>
        <script>
            require(['/module/multiLineChart/rc/multiLineChartWidget.run.js'], function (app) {

                app.initialiseMultiLineChart({
                    backgroundColor: '#263238',
                    borderColor: '#3e4e56',
                    chartPadding: '5,5,5,5', //  top, right, bottom, left
                    color1: '#7460ee',
                    color2: '#f3f5f6',
                    color3: '#009efb',
                    color4: '#009efb',
                    chartType: 'line', // line or bar
                    cubicInterpolationMode: 'default', // default or monotone
                    dataDirection: 'left', // right or left
                    dataLoadDelay: 1000, // in milliseconds
                    dateFormat: 'd/M/yy H:mm', // see help for more examples
                    divId: '#widget1',
                    height: null, // use this when maintainAspectRatio is false
                    fontFamily: 'Poppins, sans-serif', // Web fonts, e.g. arial, sans-serif
                    labels: 'Kw,Kwh,&#176;C', //&#176; is the degrees symbol
                    labelFontSize: 12,
                    labelFontColor: '#56595b',
                    lineTension: 0.4,
                    maintainAspectRatio: 'true', // when false set the height and width values
                    maxTicksLimit: 11, // maximum number of ticks and gridlines to show
                    ord1: 'history:/demoStation/AHU1?period=weekToDate|bql:select timestamp, value order by timestamp DESC', // use absolute ord for html
                    ord2: 'history:/demoStation/Boardroom?period=weekToDate|bql:select timestamp, value order by timestamp ASC',
                    ord3: 'history:/demoStation/Temp?period=weekToDate|bql:select timestamp, value order by timestamp DESC',
                    ord4: 'history:/demoStation/Temp?period=weekToDate|bql:select timestamp, value order by timestamp DESC',
                    pointRadius: 4, // set to 0 to hide points
                    precision: 2,
                    refreshInterval: 60000, // in milliseconds
                    selectBorderColor: '#d9d9d9',
                    showChartBackgroudStyle: 'true',
                    showGridLines: 'false',
                    showOrd1OnRightAxis: 'false',
                    showOrd2OnRightAxis: 'false',
                    showOrd3OnRightAxis: 'true',
                    staticLineColor1: '#28a745',
                    staticLineColor2: '#007bff',
                    staticDataValue1: '', // numeric value
                    staticDataValue2: '', // numeric value
                    staticDataLabel1: '', // label to show on chart
                    staticDataLabel2: '', // label to show on chart
                    titleFontColor: '#ffffff',
                    titleFontSize: '18px',
                    titleFontWeight: '400',
                    title: 'Chart 1',
                    width: null, // use this when maintainAspectRatio is false
                    xAxisLabel: 'Time'
                });
            });
        </script>
        </head>
        <!--html to go here-->
        <div id="widget1" style="width:300px;height:300px;"></div>
        <!--Rest of your html below...-->
                                    

You May Also Like


Energy Benchmark Chart

N4 View Builder™©

tridium bms system

Comparison Charts

tridium charting

back to more widgets...