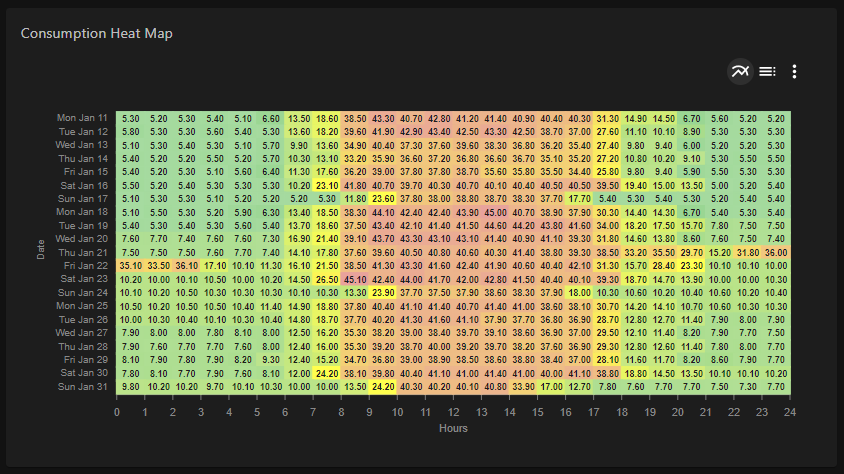
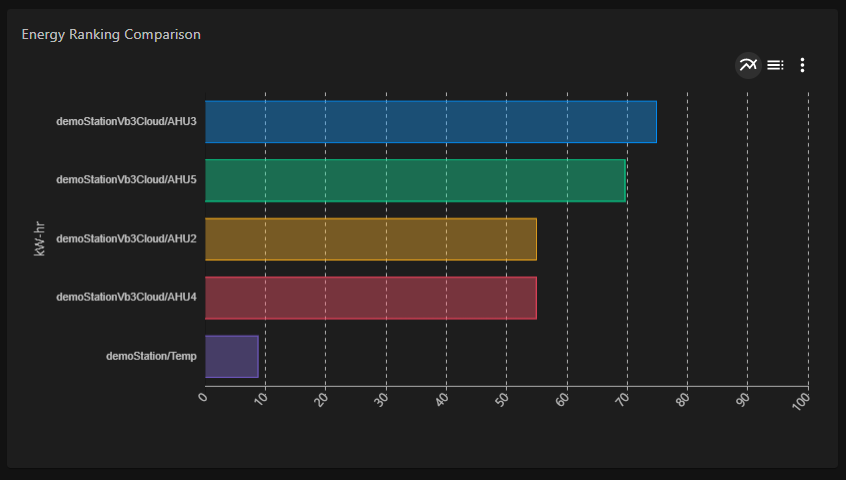
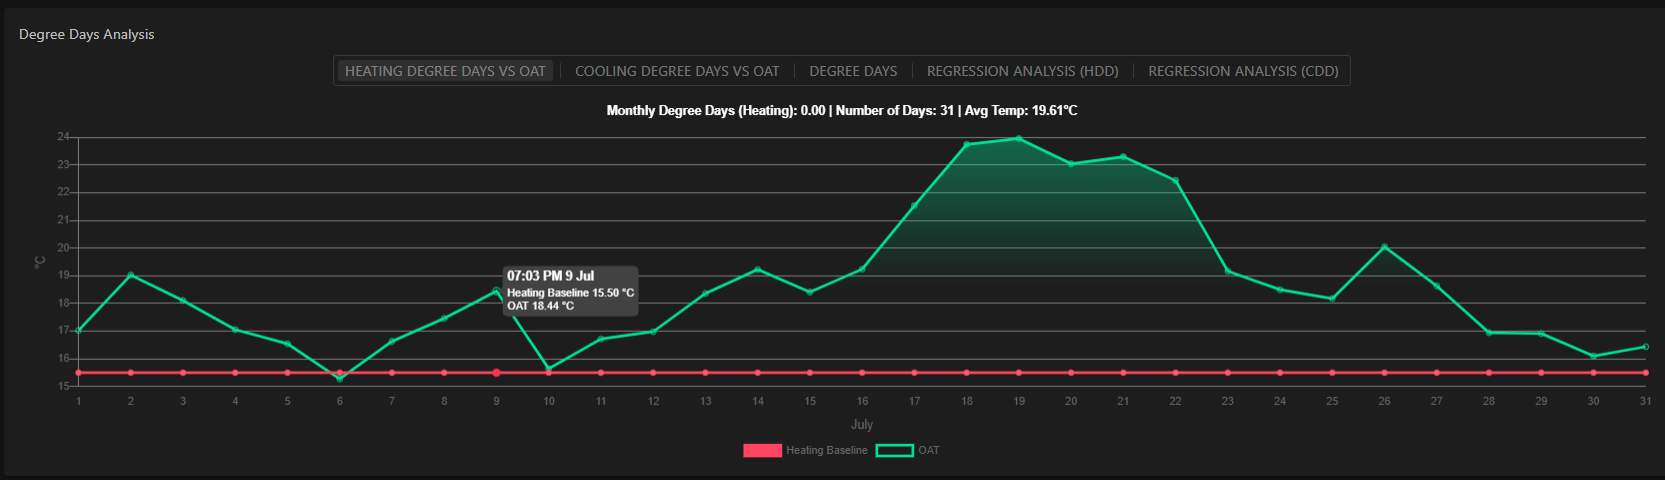
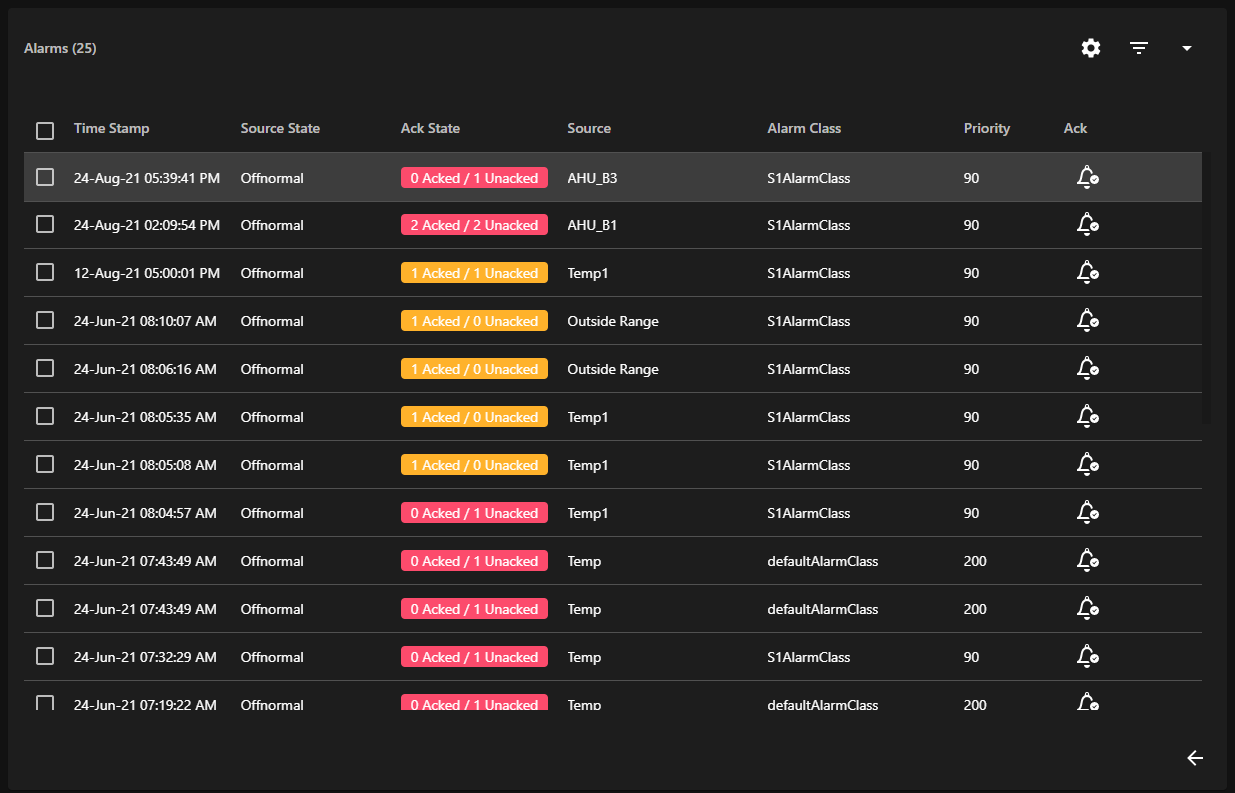
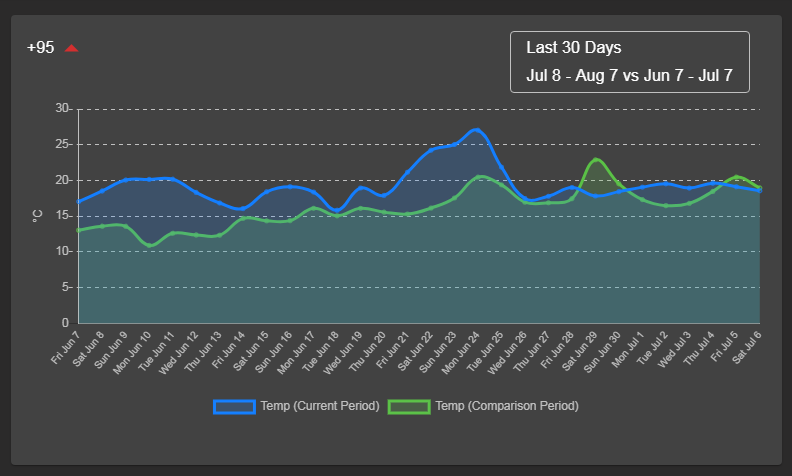
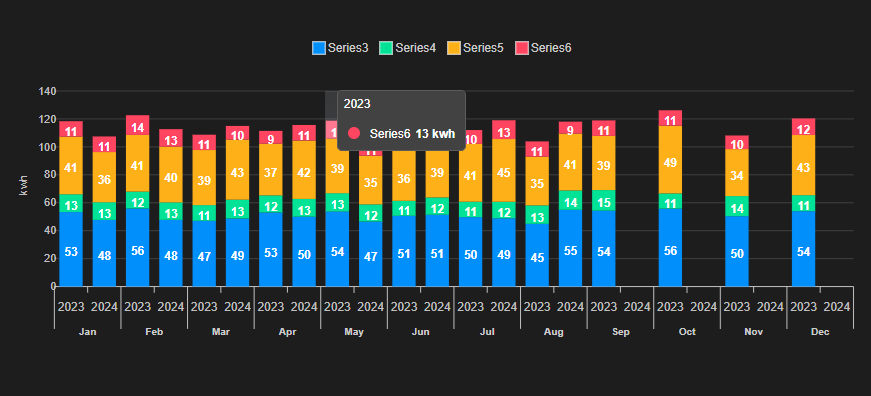
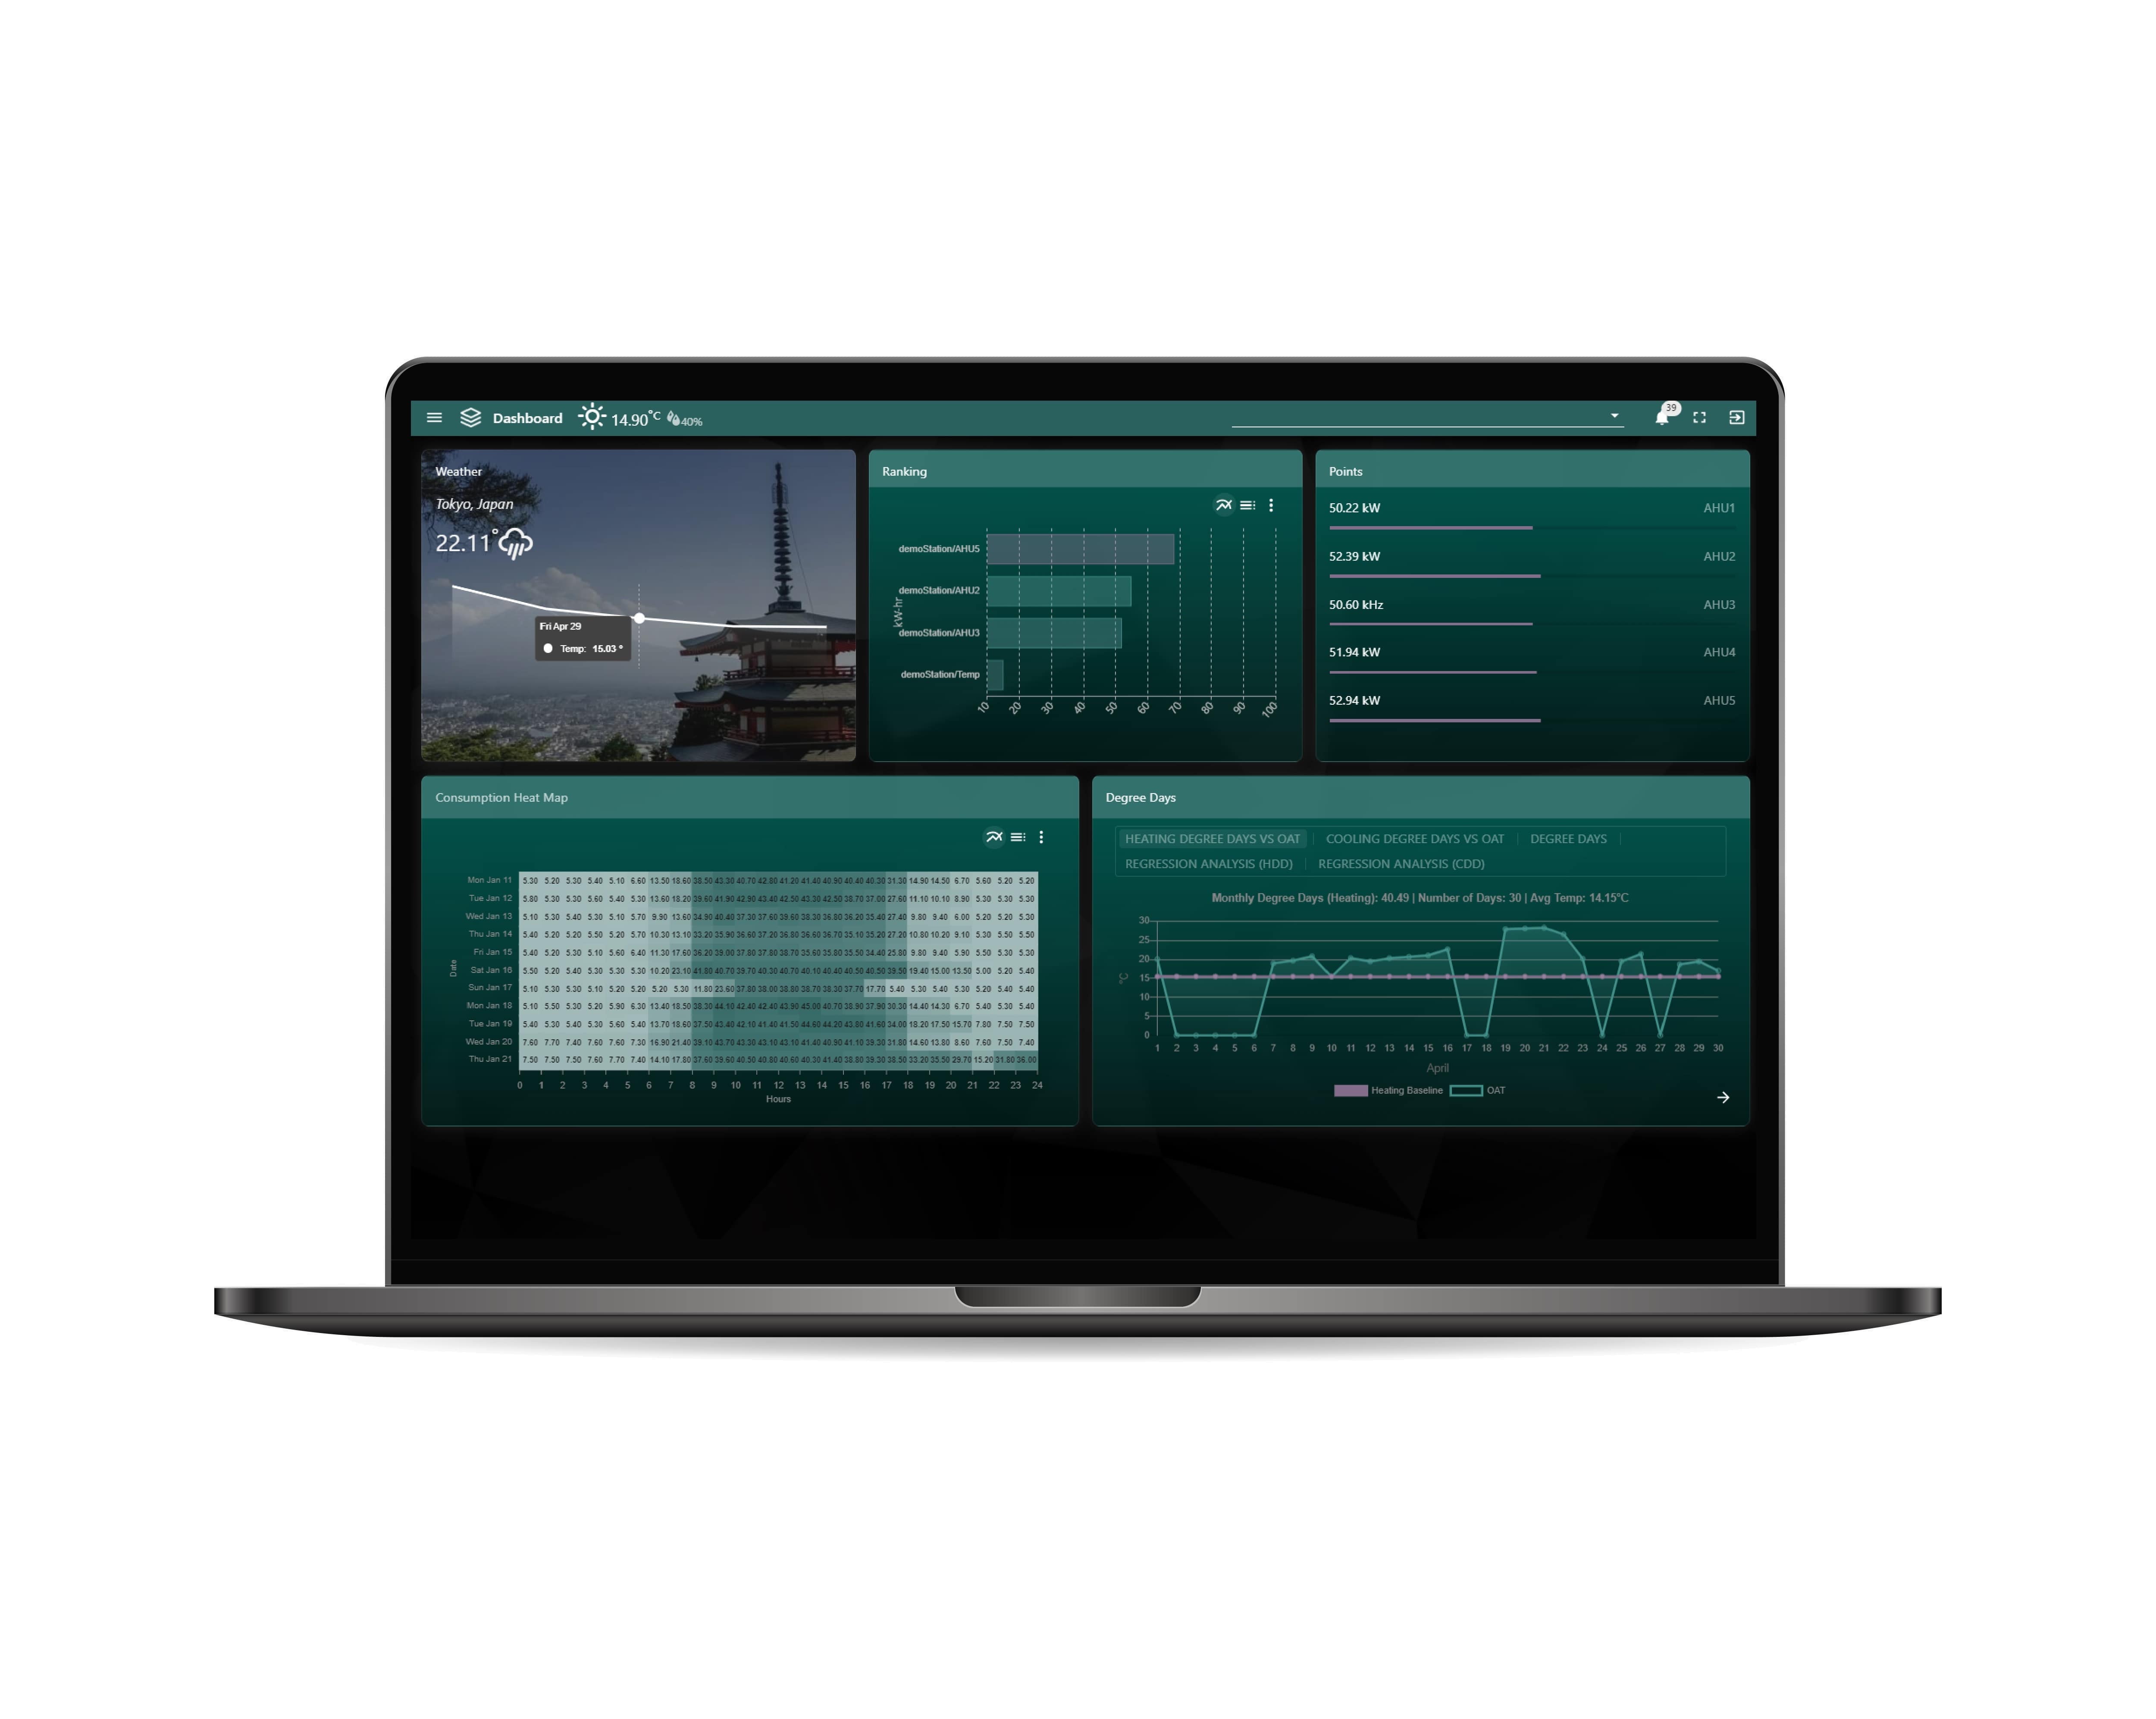
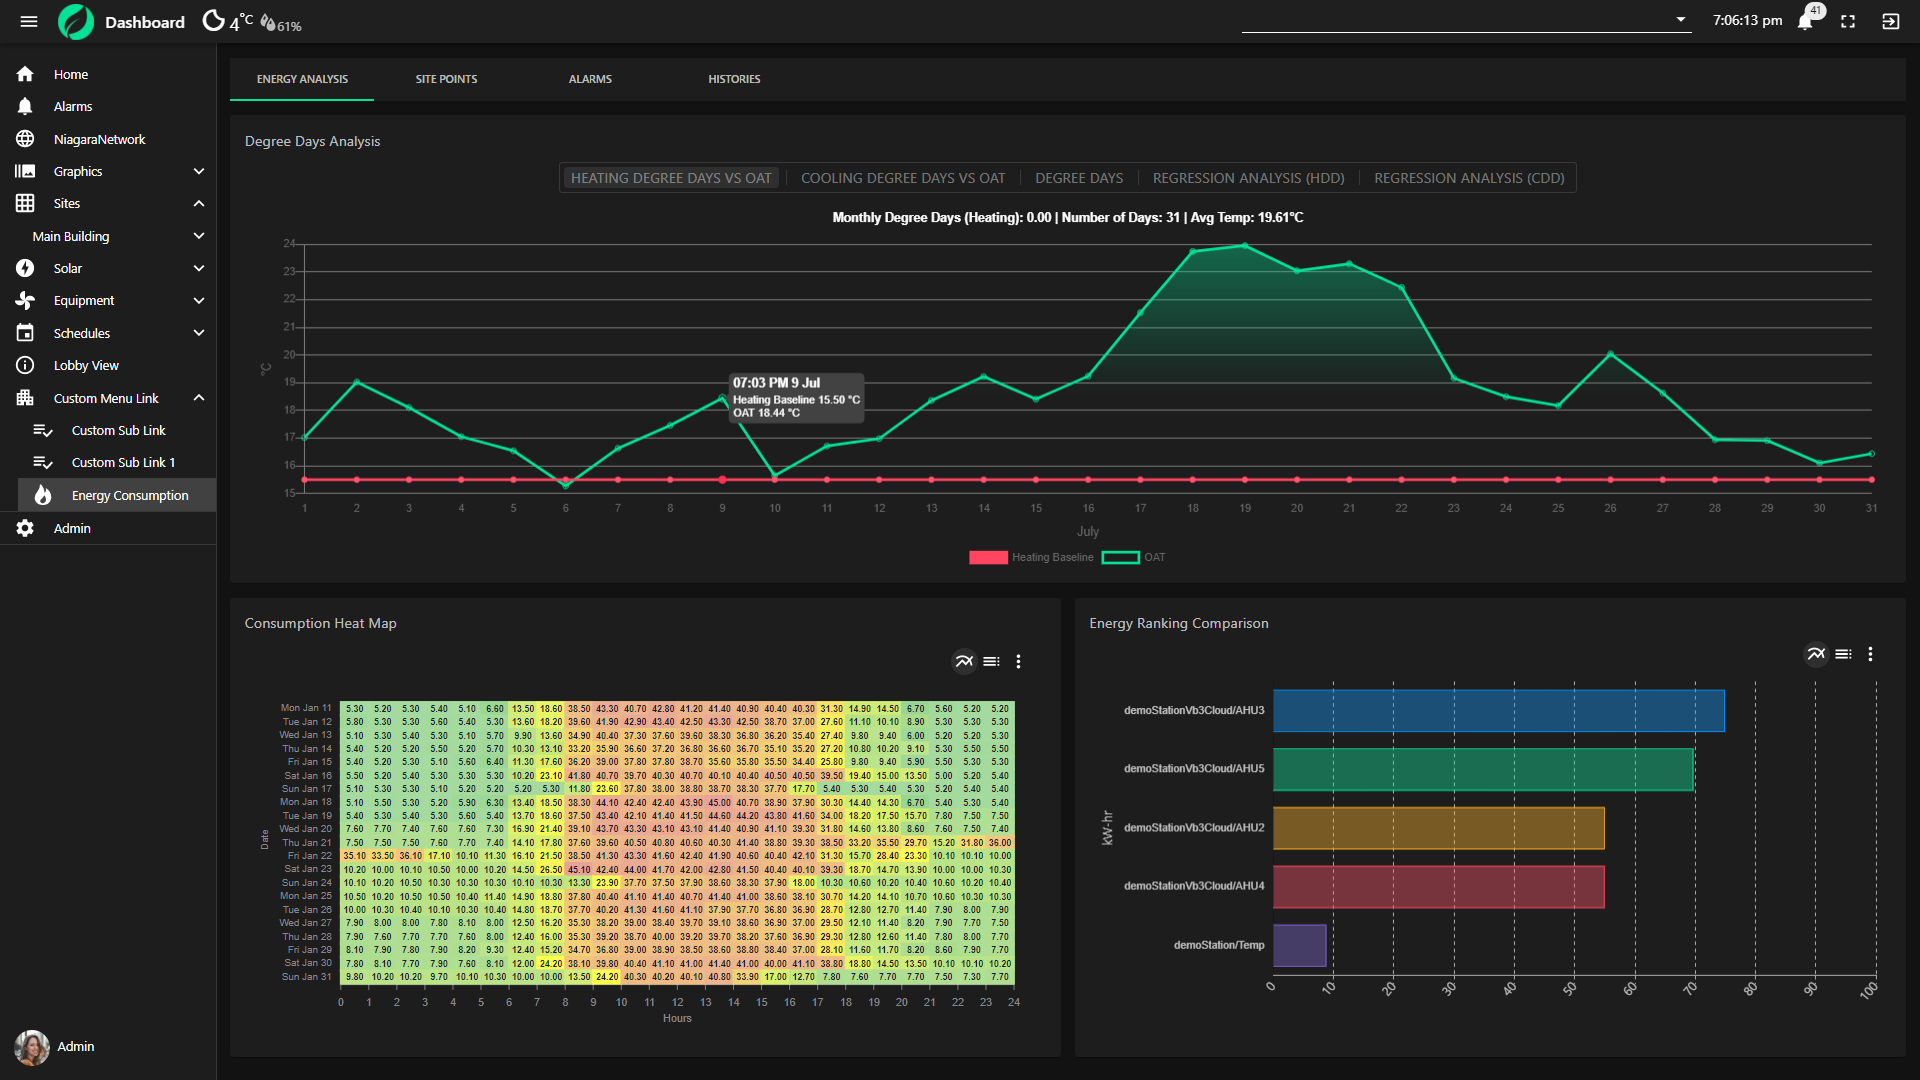
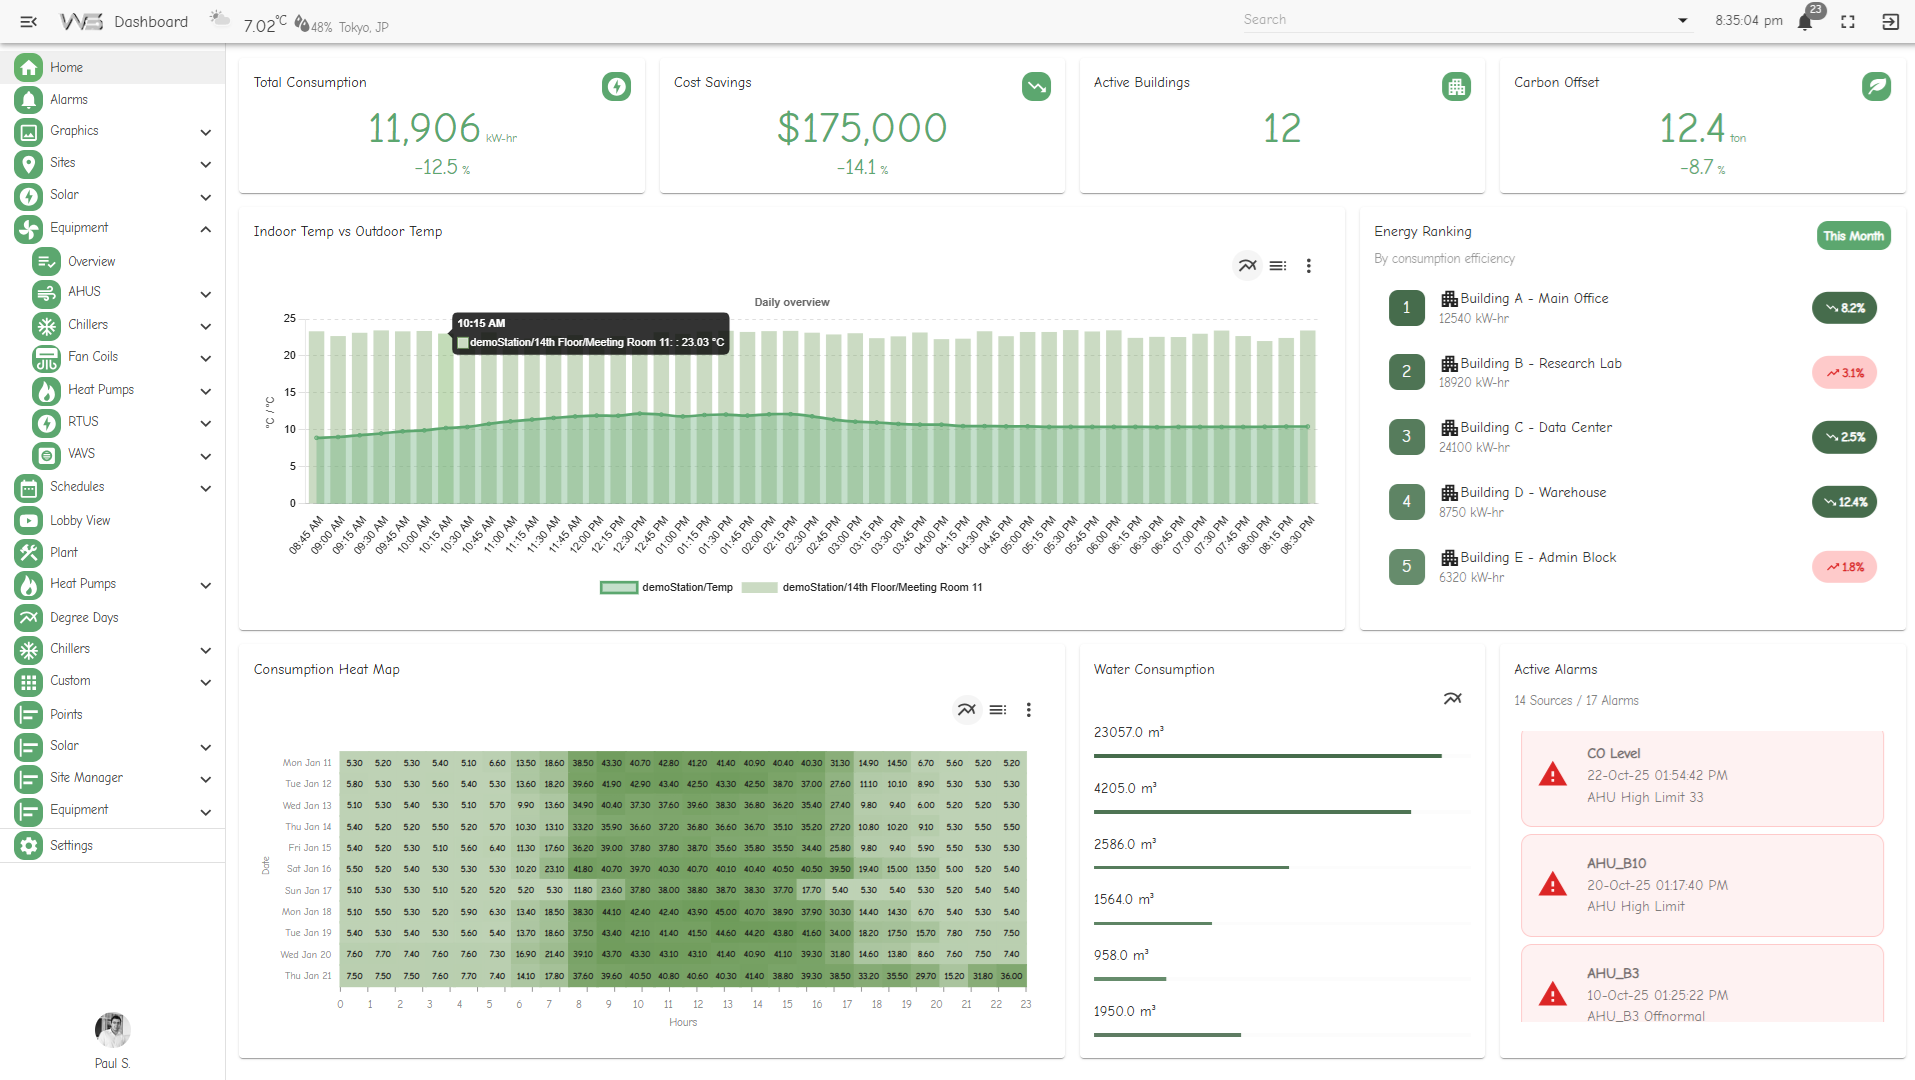
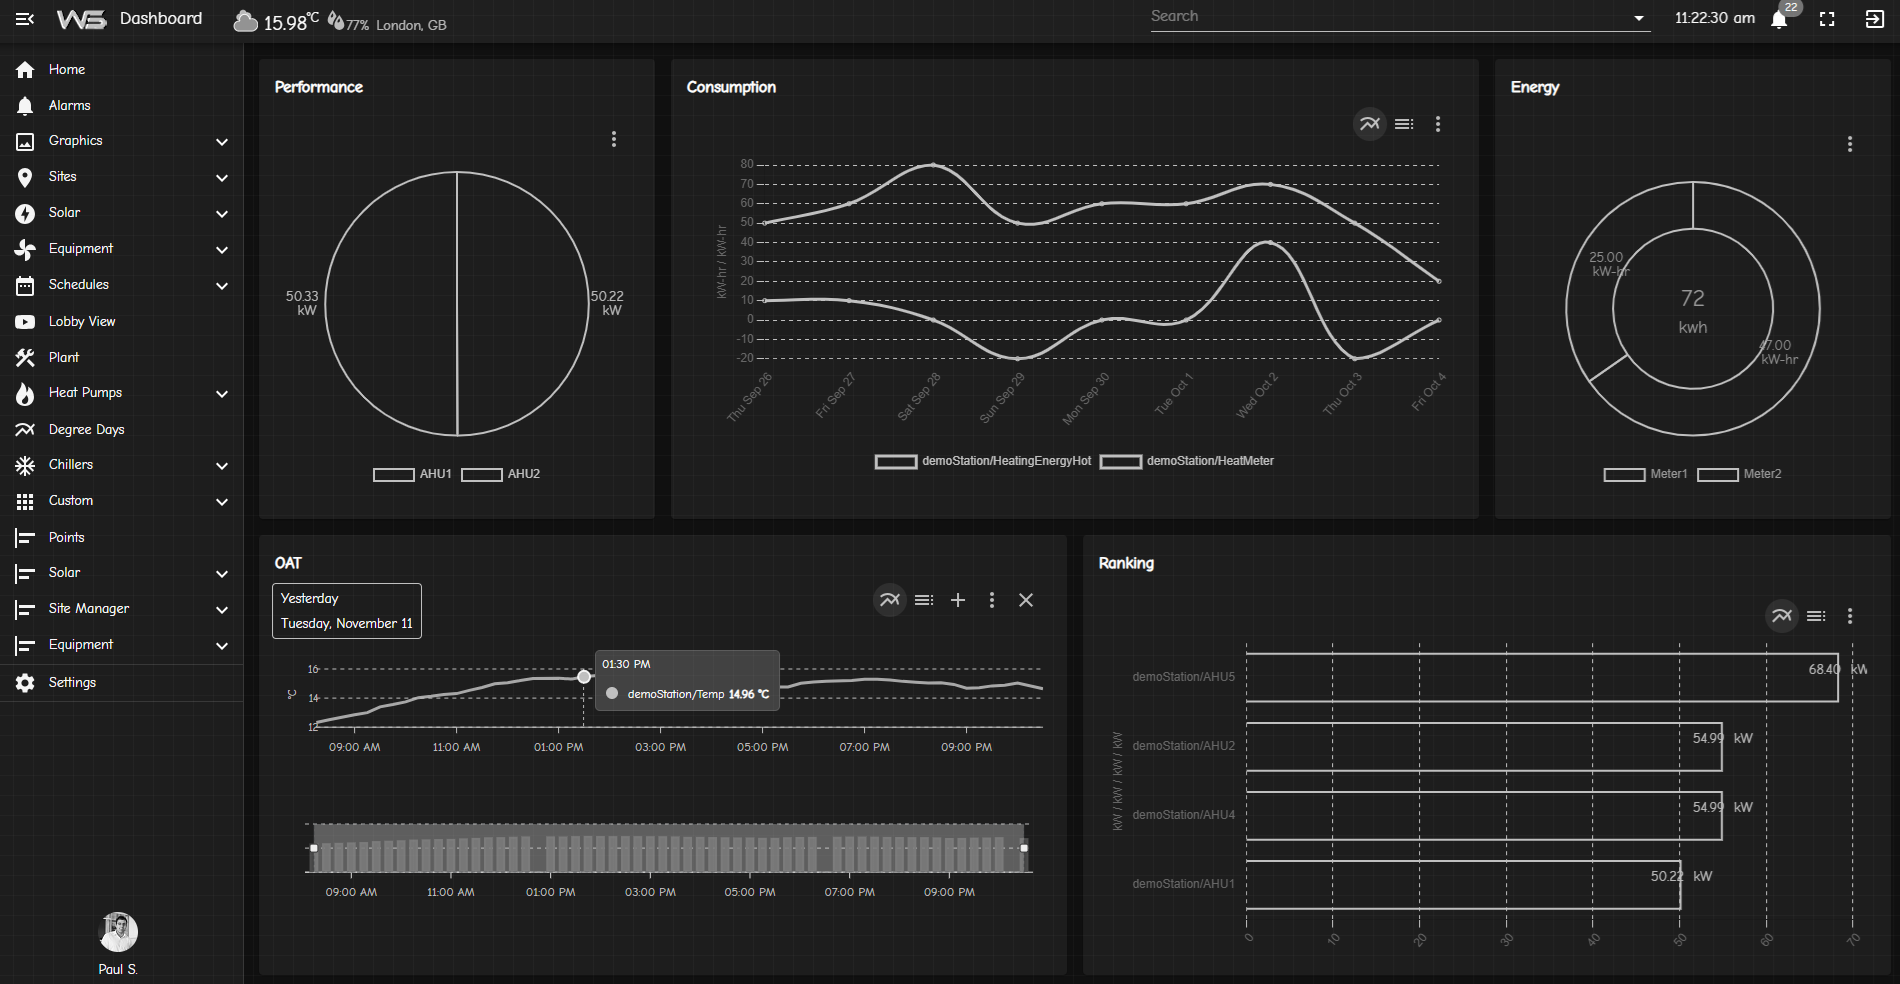
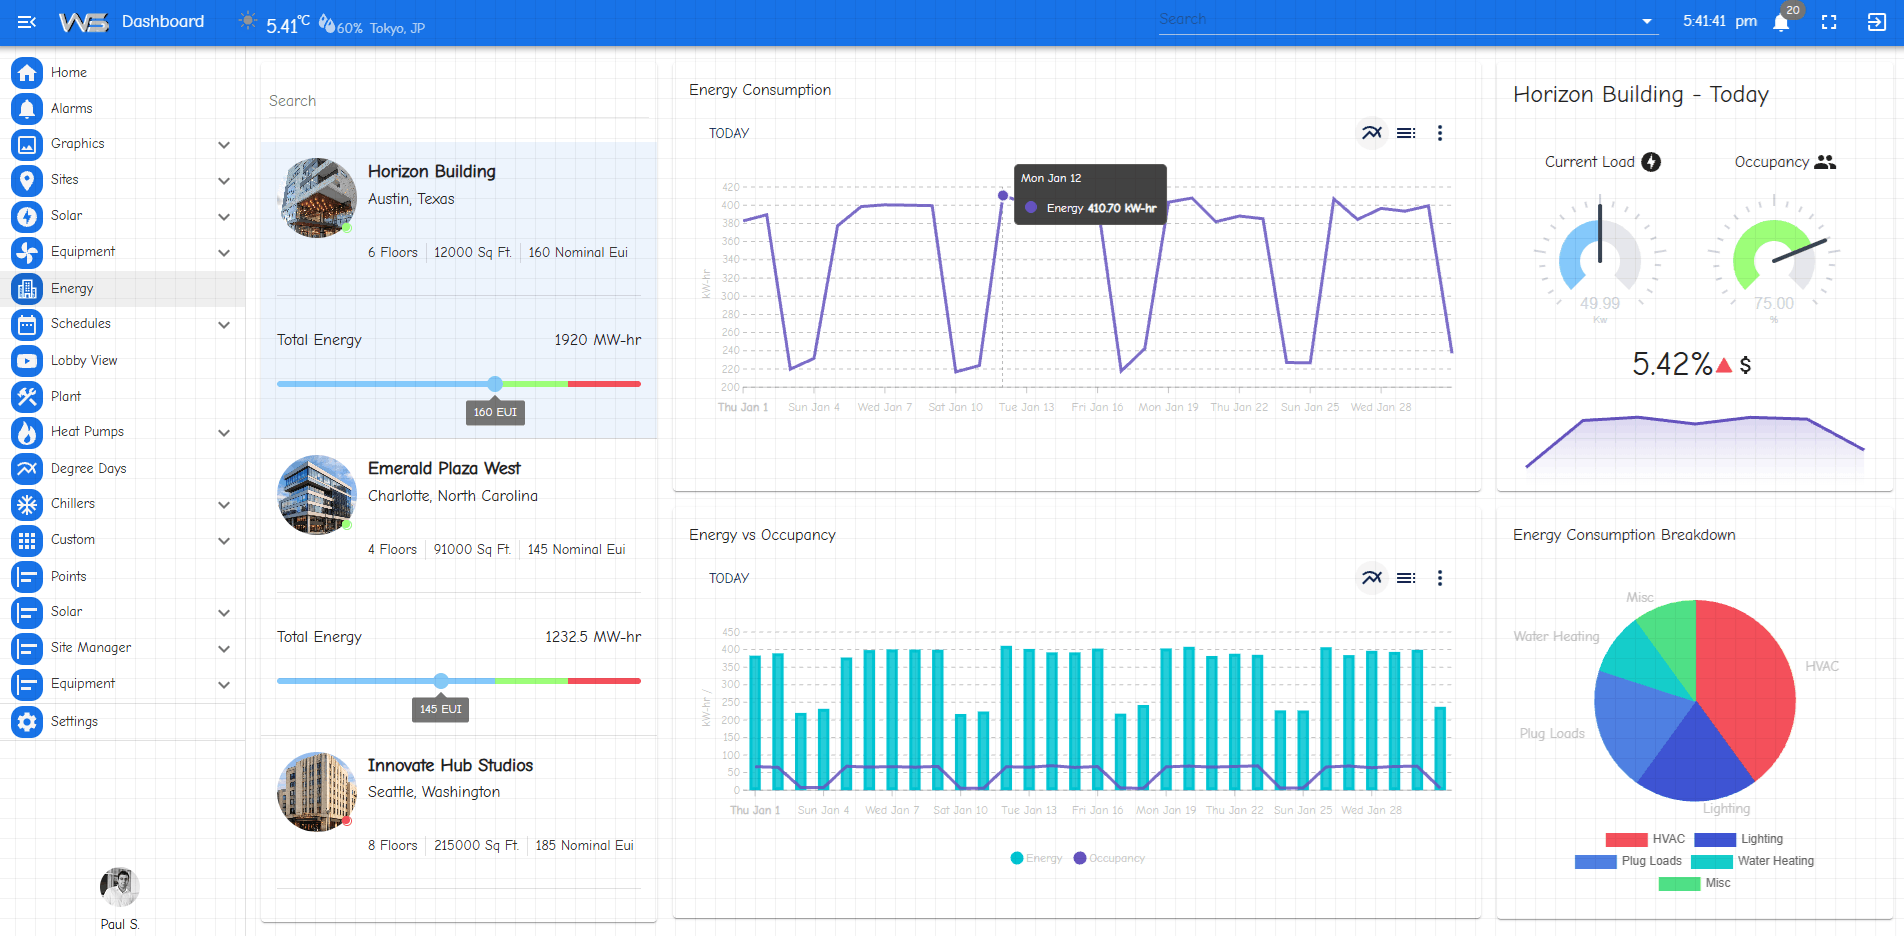
The updated N4 Consumption View shows current energy consumption, ranking, Degree Days linear regression, histories, weather, alarms, and a heat map.
The template also includes PX View, Alarm View, N4 Alarms To Line Messenger, and
N4 Alarms To Slack,
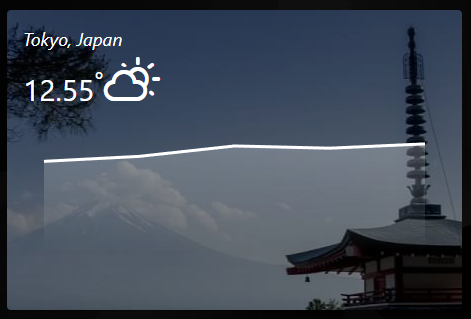
Free Weather Service which can be used on any project.
Also check out our widgets.
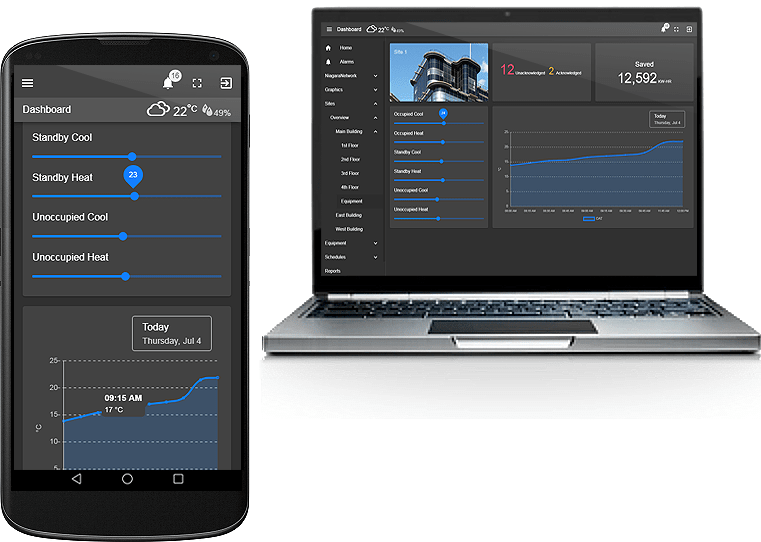
This view helping manage energy, analyze, and optimize the operation of facilities.
It enables the user to collect and manage all major aspects of energy data and view on screen. In the settings you can adjust to
show any time/value data. Set the energy benchmarks and detect low energy-efficiency areas by
comparing consumptions against similar periods. Get an overview of the energy and associated costs for different zones, buildings,
or time periods.
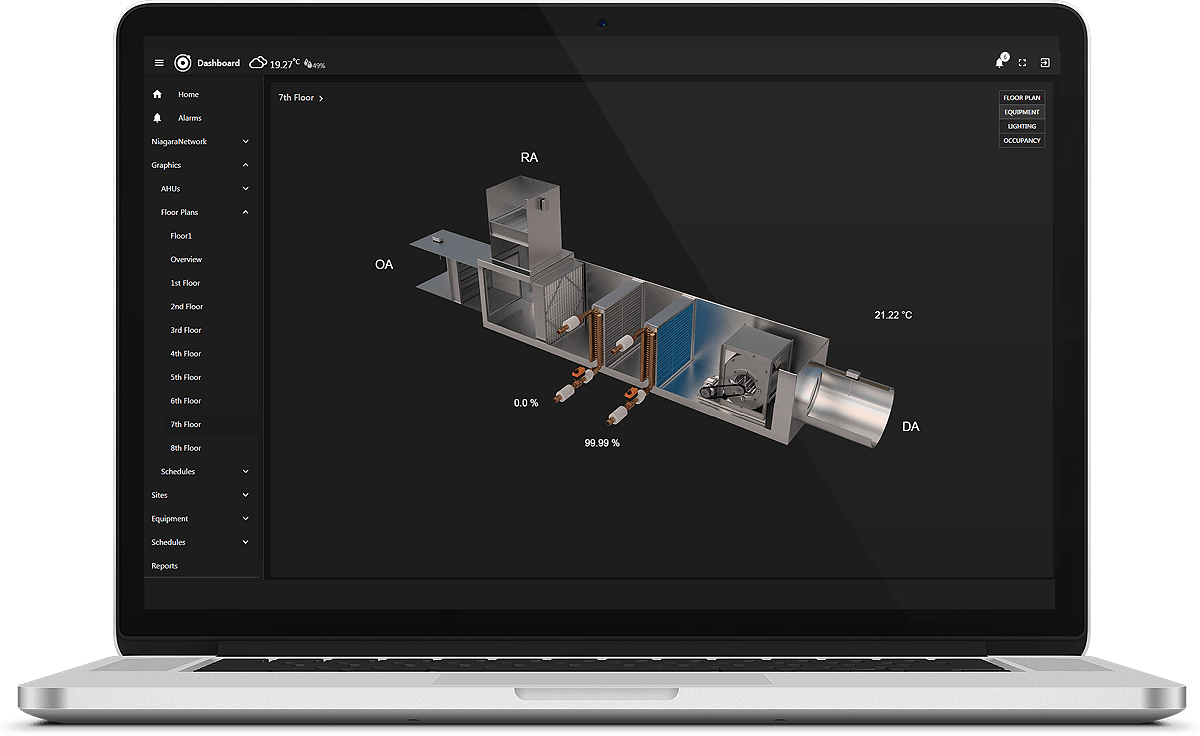
You can choose different layouts and widgets to only show what you need to show. Tabs view is included as well as role/permissions. The widgets included in the dashboard are
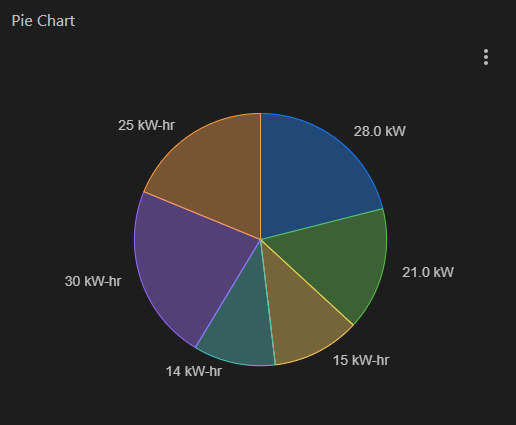
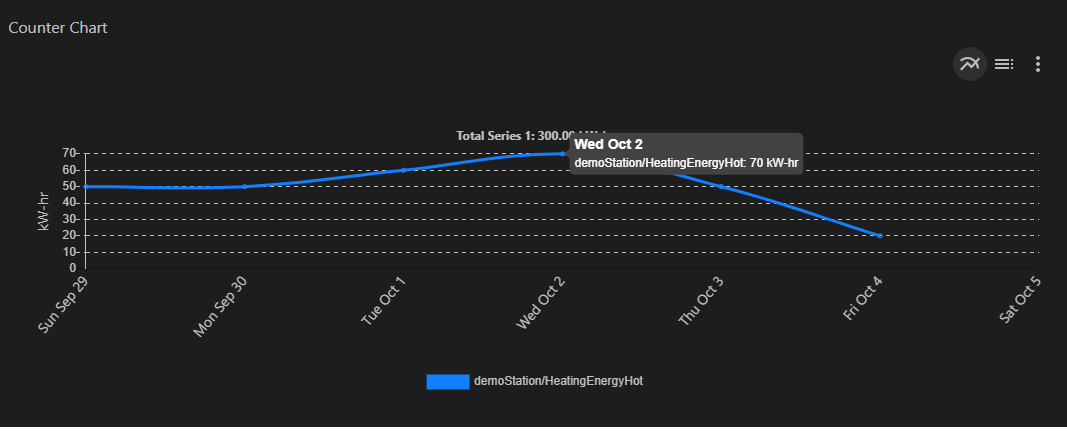
Px View, point label, Gauge, Alarm Table, Line Chart, History Chart, Heat Map, Ranking Chart, Degree Day Regression Chart, Pie Chart, Stacked Bar Graph, Weather Location with Forecast, Free Text,
Sensor Bar, and blank card.
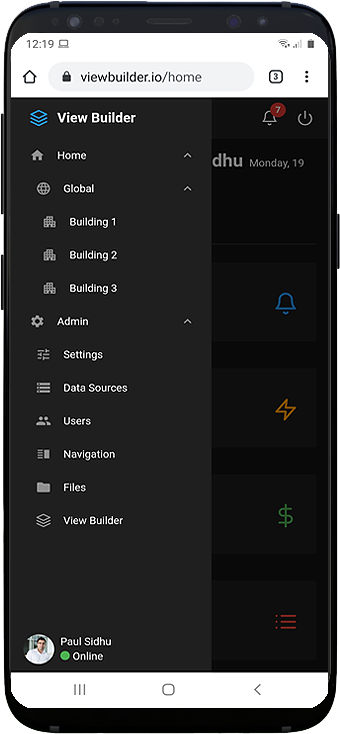
Are you looking for a cost effective way to show energy data to your customers? Why not have a look at View Builder.