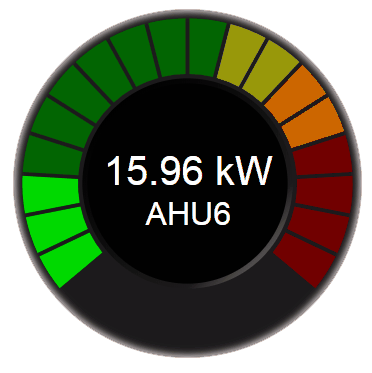
Niagara Spectrum Gauge
- Drag n' Drop
- Binds to numeric point, numeric writable, or history
- Renders in all major browsers
- Clean pristine animation
- Spectrum Color Binding
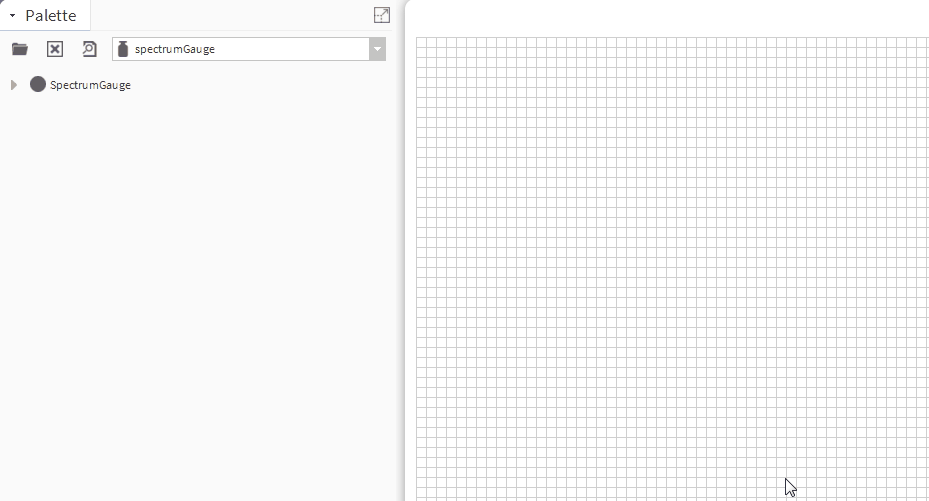
Drag and drop the Spectrum Gauge widget from the palette onto your px view. It automatically updates when the point or history value changes. Its completely configurable and easy to use.
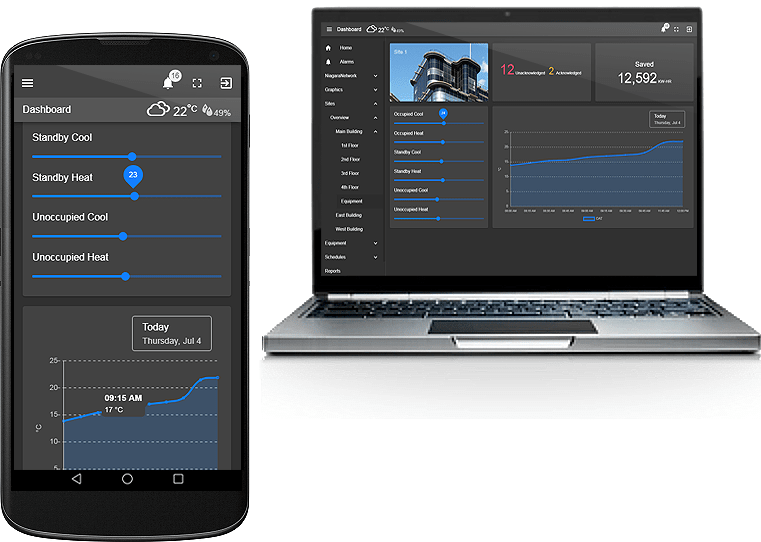
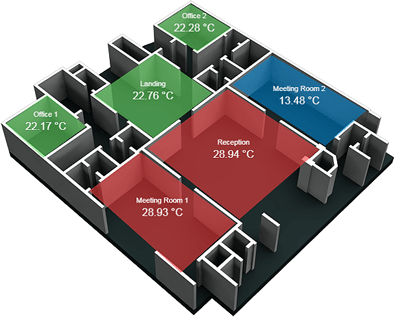
Are you looking for a cost effective way to manage and visualize data for all your customers? Why not have a look at View Builder?
Before you start. Download the modules from our portal (see your order confirmation, which also explains licensing). Copy the modules file to your modules directory. Restart BOTH station and Workbench.
1. Copy the spectrumGauge-ux.jar file to your modules directory.
2. Open the module from your palette file.
3. Drag and drop the widget from the palette onto your px view.
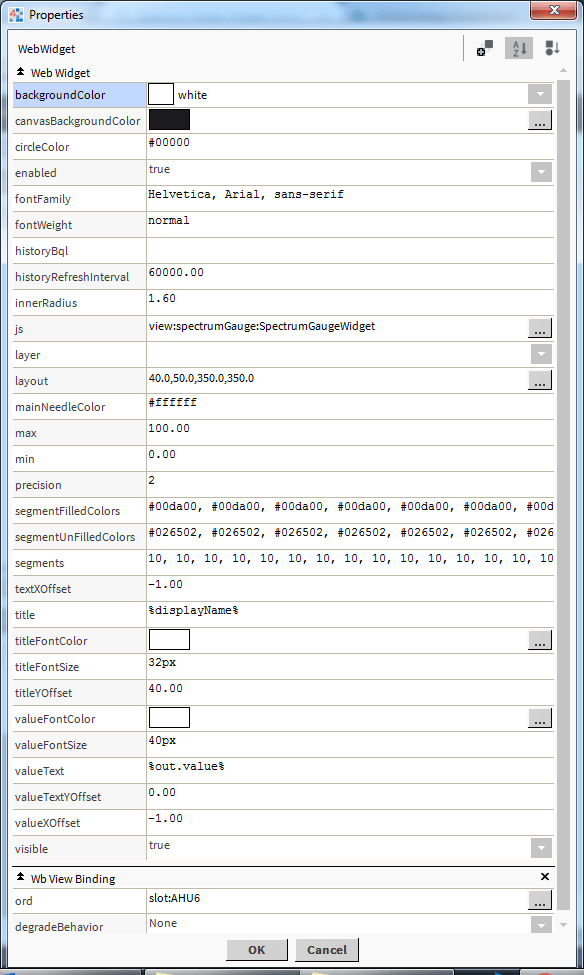
The gauge has a number of configurable properties that can be used to modify look, feel, and functionality. Change the properties as required.
Main Chart Binding:
Set this to an absolute ord, e.g.
station:|slot:/Drivers/NiagaraNetwork/AHU5 or relativized ORD e.g.
slot:AHU5
The ord should point to a numeric point/writable that has a numeric interval extension.
Background Property:
The background (the area within the circular part of the widget) can be changed to a solid color, gradient, image, or null(transparent). The image must reference a file ord reference e.g. file:^myImage.jpg, and fit within the bounds of the widget.
Layout:
Make sure the layout width/height are equal otherwise the gauge will not scale correctly.
Segment Colors:
There are 3 properties related to the segements.:
Segments: which are the percentage size for each segment
SegmentFilledColors: are the areas which are shaded when the value reaches the segment value
SegmentUnFilledcolors: opposite to segmentFilledColors.
History Binding:
You can bind the gauge to a history reference. Change the properties as required:
1. Set the value binding as normal.
The value binding must be set in order to gather history records for the point.
2. Set the history BQL property.
Examples:
|bql:history:HistoryRollup.rollup (history:RollupInterval 'monthly')|bql:select max
|bql:history:HistoryRollup.rollup (history:RollupInterval 'monthly')|bql:select min
|bql:history:HistoryRollup.rollup (history:RollupInterval 'monthly')|bql:select avg
|bql:history:HistoryRollup.rollup (history:RollupInterval 'monthly')|bql:select sum
Build Your Own dashboards and win Projects by showing data that increase value and reduces expenditure.